Hi, I am Dharminder Dhanda


UX/UI designer

Front-end developer,

Datavis designer (D3.js expert)

What Am Best At

UX/UI expert, data visulaization, front-end development
data modelling, dashboarding, story telling & infographics

Responsive Websites

I am an expert in creating websites that work on all devices and browsers using HTML5 and modern frameworks like Bootstrap".

Single Page Apps

Web apps that load a single HTML page and dynamically update that page using knockout.js, angular.js, require.js and other similar libraries.

Data Visulisation

From last 2 year I have been working on the different data visualisation project the require expert level of d3.js knowledge.

UX/UI

Love to create the best usuability, design and experience for the application using my years of experience in similar field.

Technology Tags

Click on the buttons bottom-left to classify.

About Me

I am Dharminder Dhanda, UX/UI designer, front-end developer and datavis designer. I have a Master of Information Technology from Deakin University Melbourne. I code, analyse and make data understandable with visualisations.

Read Blog

Skills I Got the

95

Data Visualization (D3)

90

HTML5 / CSS3

80

JavaScript/Jquery

75

UI / UX

70

Knockout/Angular

60

C#/Web services

40

SQL/MDX

20

ML/Python/R

Featured project

I have been working on Datafizz from last 18 months. Please take a look at the video.

My Works

I've worked with many serious brands in the Design and Code industry.
See a collection of works I am proud of!

JL Electrics

Web site

J L Electrics

J L ELECTRICS PTY LTD established its company in 2005 specialising in Electrical Designing , Contracting and Maintenance work for Mining , Industrial , Commercial and Residential sector through out Victoria and the South Pacific (Fiji Islands, Vanuatu,Tonga, Samoa, Cook Islands and New Zealand).

Visit Website

Pedestrians injuries in United States

Web site

Pedestrians injuries in United States

This website is telling the statistics of pedestrian injuries in United States. Story is build using d3.js and impress.js to make more interative and easy to understand.

Visit Website

Bubble chart for Power BI

Data analytics

Bubble chart for Power BI

Visit Website

Parallel Coordinate chart for Power BI

Data analytics

Parallel Coordinate chart for Power BI

Another custom visual for Microsoft Power BI.

Visit Website

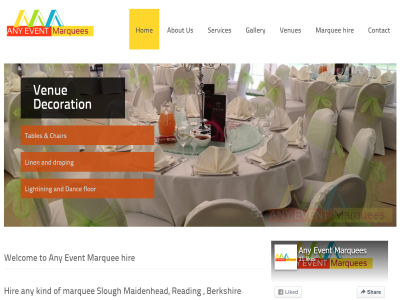
Any Event marquees

website

Any Event marquees

Any event marquees is marquee and catering business based in Uk. I did that website early in my career to gain experience and add an extra website to my portfolio.

Visit Website

Sugar Cube Wireframes

Wireframes

Sugar Cube Wireframes

Visit Website

Contact me

Drop Me a Line

Mobile: +61 490080541
Email: dhandaweb@gmail.com