Heatmap are useful to understand the relationship between a single measure and two attributes. It displays data in 2 dimension in data matrix.
Get more information | Buy now
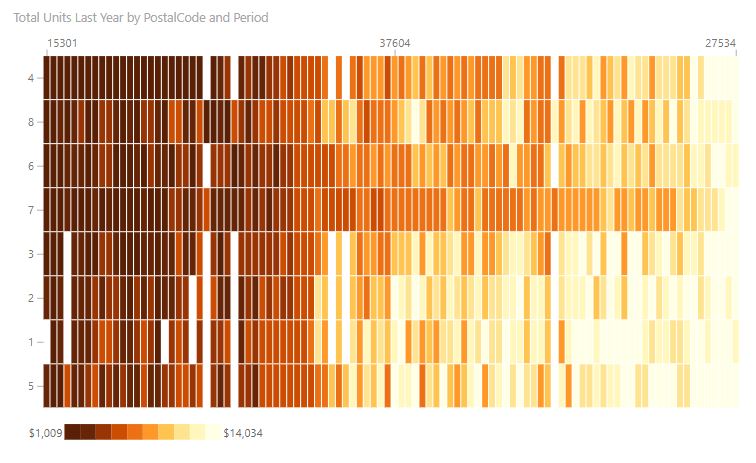
Barcode chart for powerBI
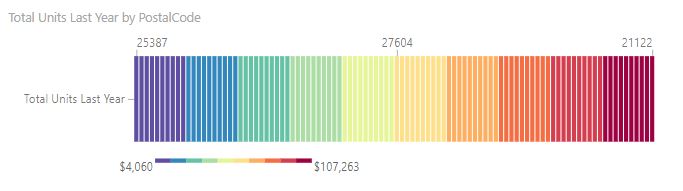
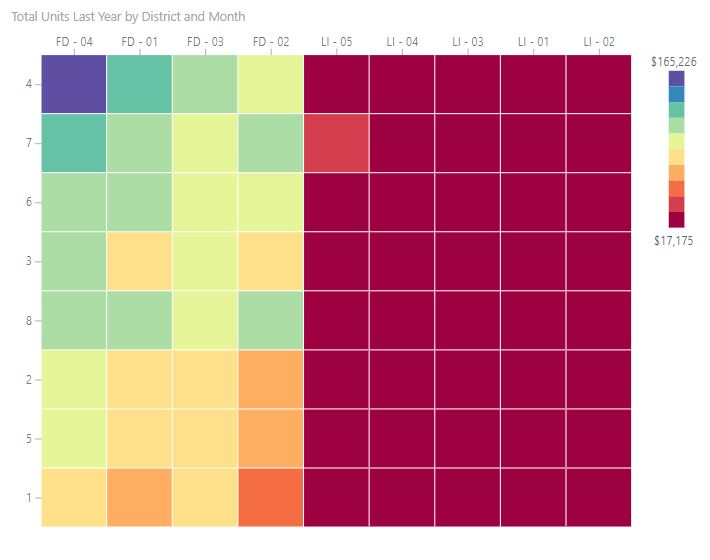
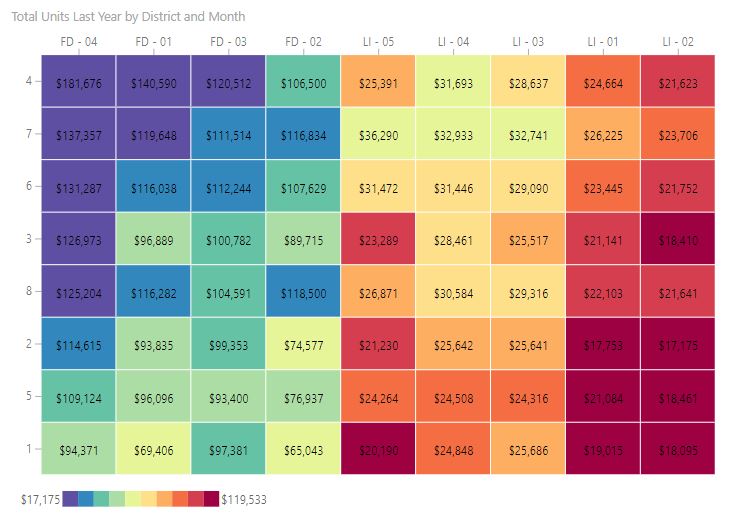
Heatmap are useful to understand the relationship between a single measure and two attributes. It displays data in 2 dimension in data matrix.
Get more information | Buy now
Barcode chart for powerBI