Over the past 1 year I have been developing lot of charts with d3.js. and I thought of taking it to next level.
So just for fun I was exploring the Qlik sense developer environment and got to know that developing custom visualization in Qlik sense is not that hard.
I started with downloading the desktop version of Qlik sense and started following a simple tutorial.
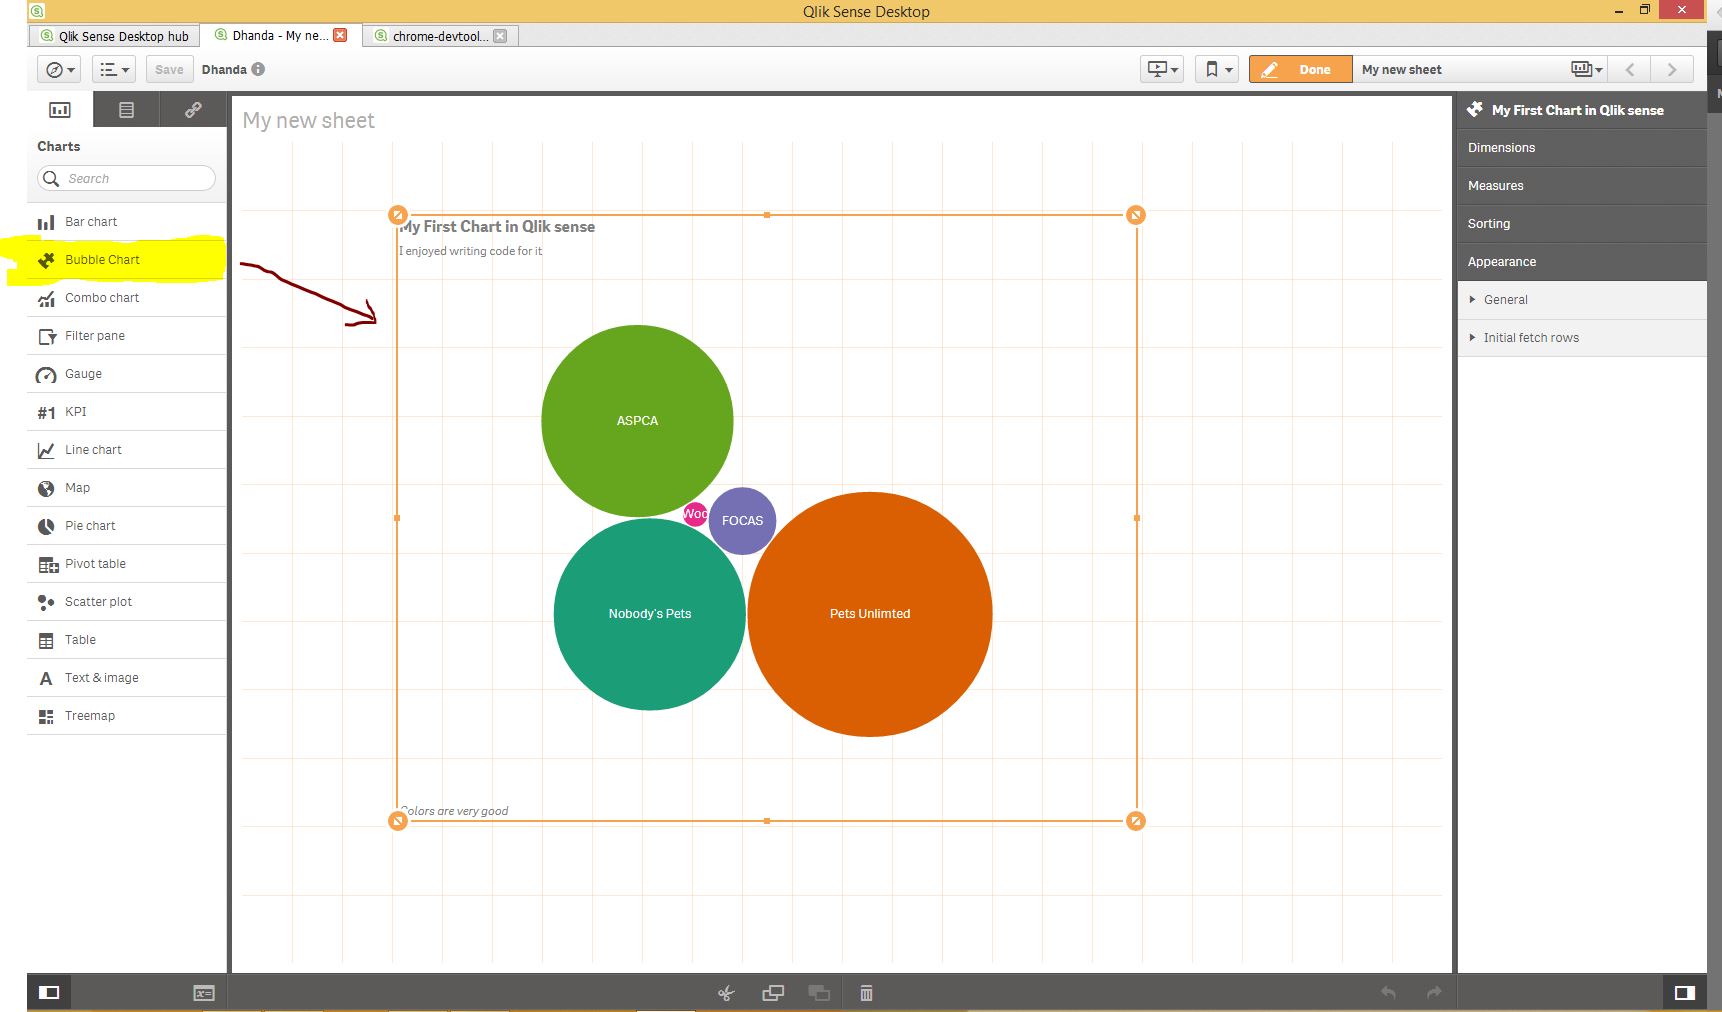
In just 3 hours, I manage to develop the BUBBLE CHART in Qlik sense. Please see the image below.
Download the extension files from here :https://github.com/dhandaweb/Qlik-sense-charts
Now creating a bubble chart was simple but main aim of this exercise was to understand:
- How the development environment works.
- How we can test and trouble shoot.
- How it can be integrated in the current system.
- How the Back end Api’s work.
Now that I understand all above I will be sharing some very existing visualization for Qlik sense in my next posts.