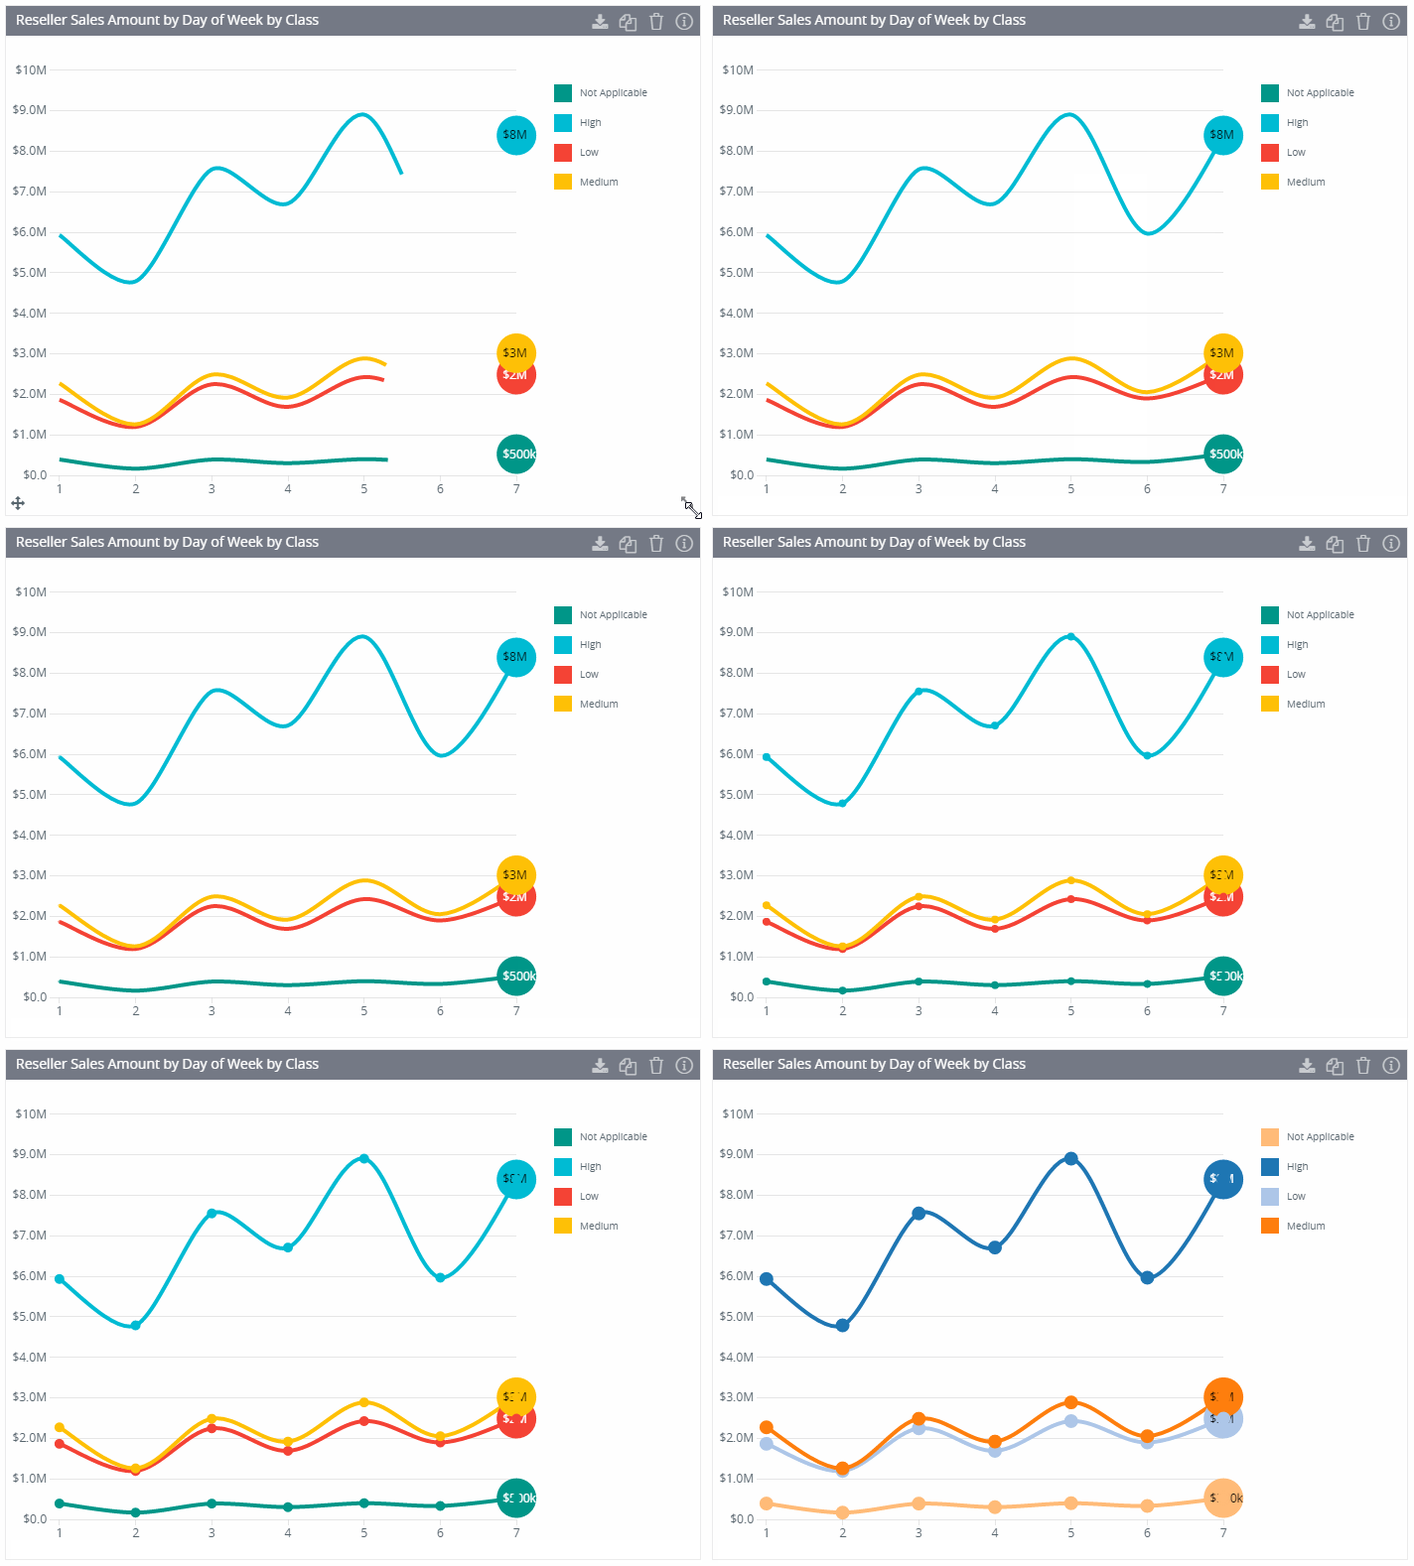
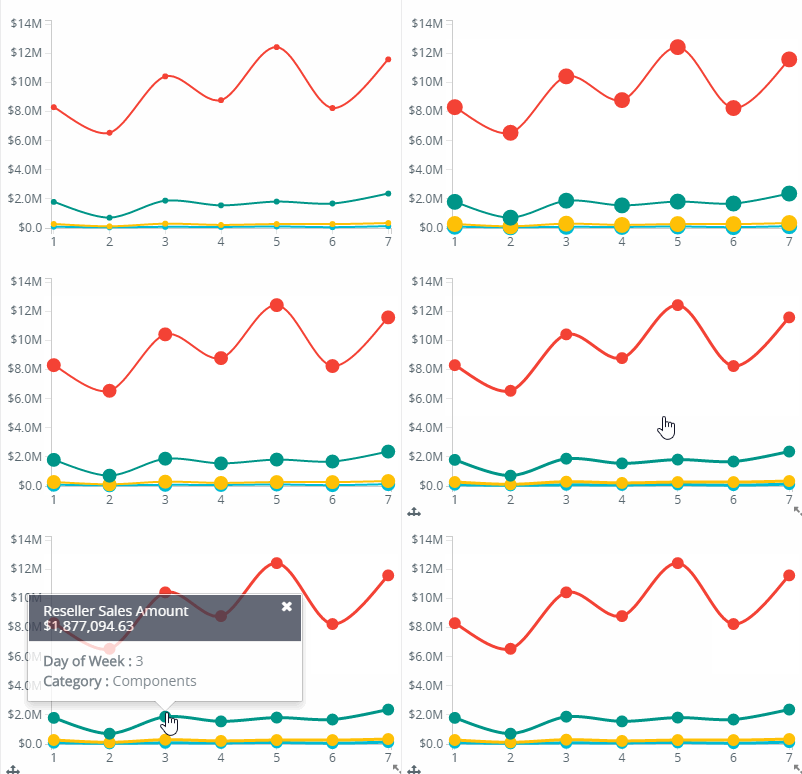
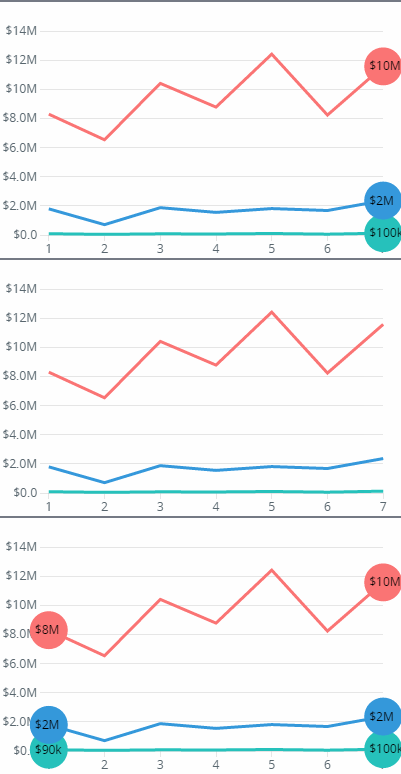
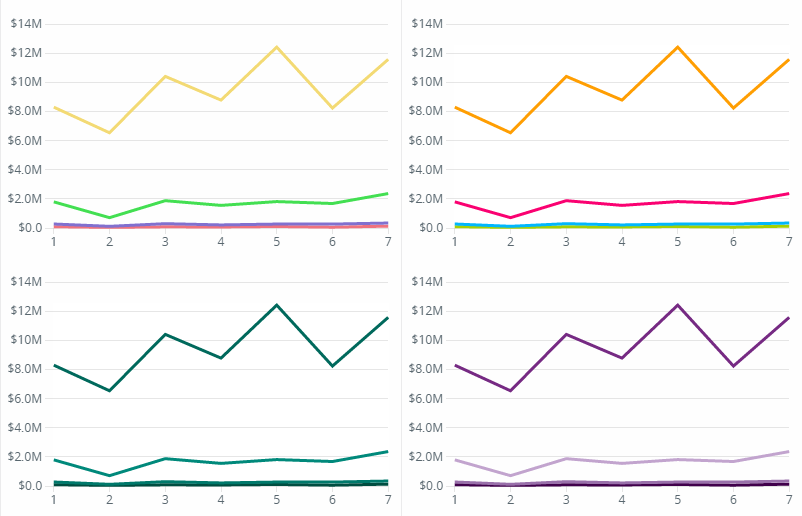
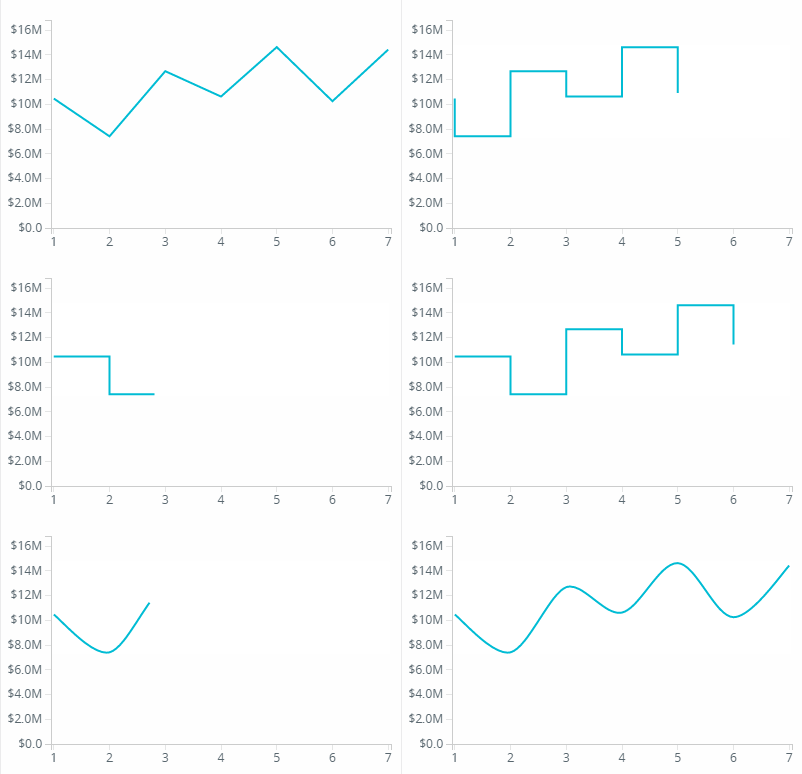
Line charts are useful for displaying data over time. Includes options on the type of line – curved, linear, stepped.
Properties of Lie Chart
- Tooltip Circle (Increase Radius)
2. End and Start Bubble
3. Change color scheme
4. Curve Type
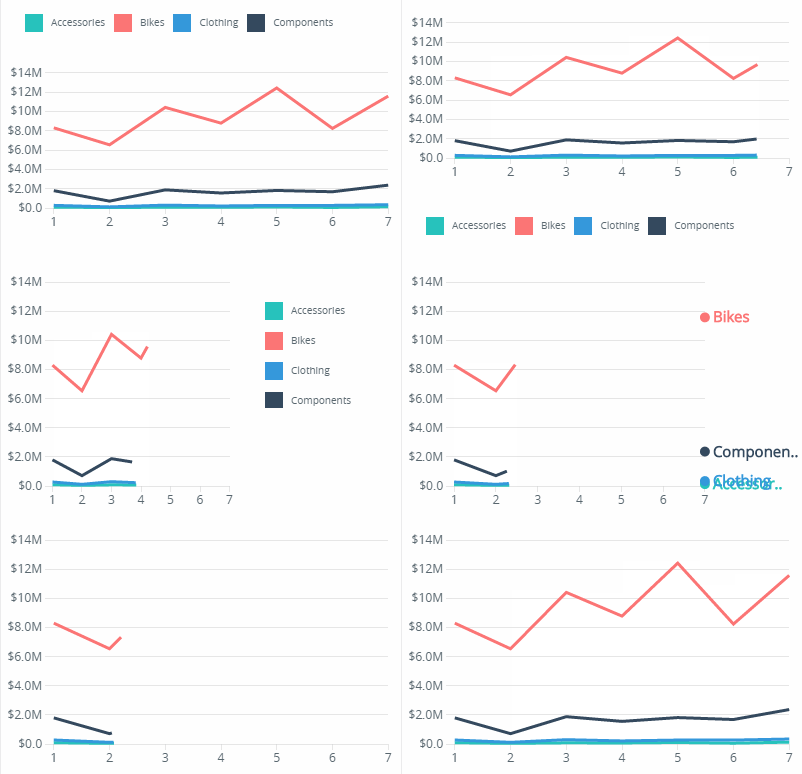
5. Legend Position and Type
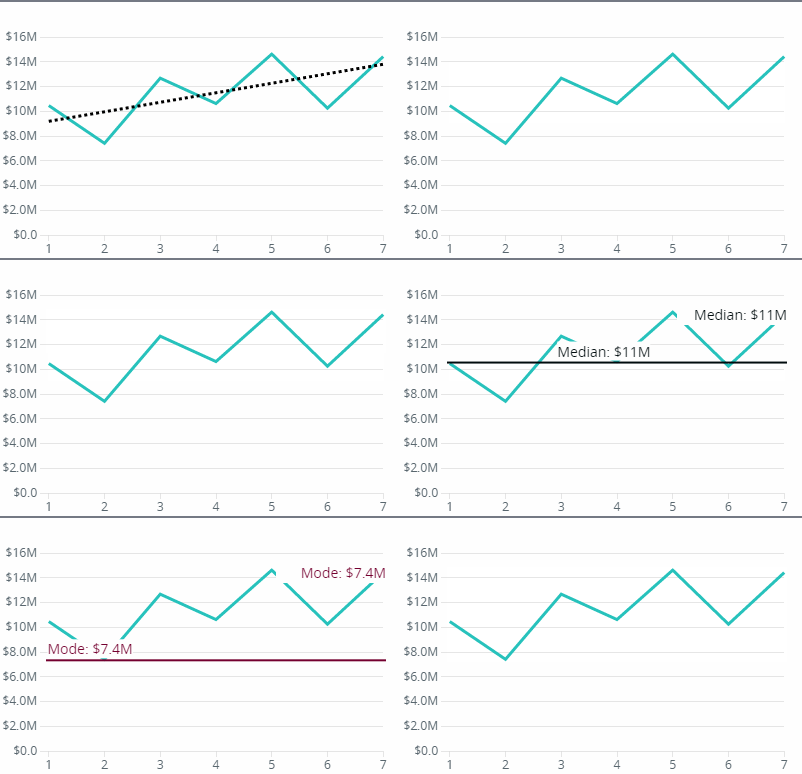
6. Statistics (Mean, Regression, Median, Mode)
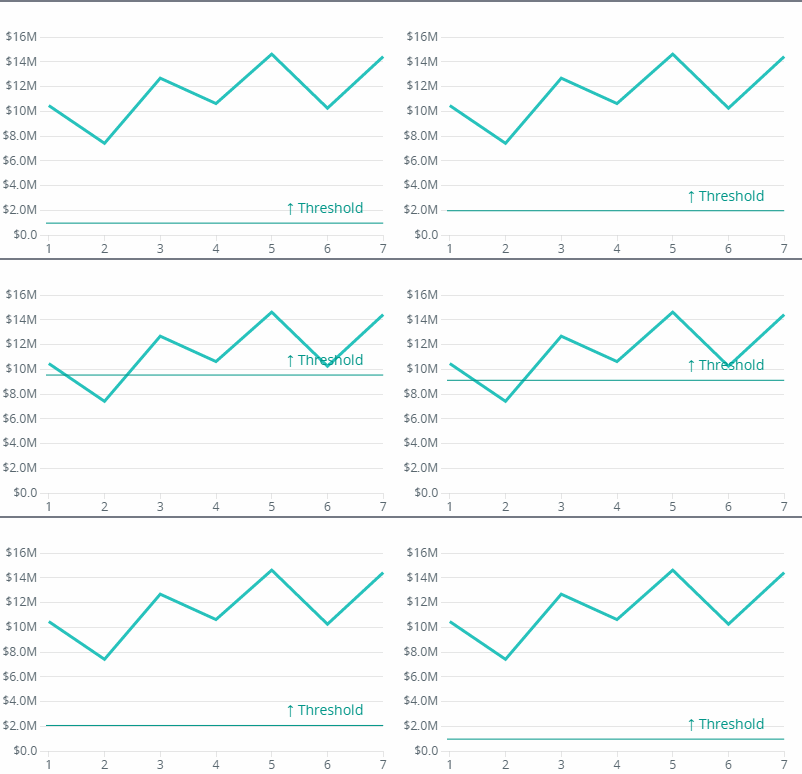
7. Threshold Line
