Driver tree (hierachy tree) in Qlik sense

Now that I got to know how the custom visuals can be developed in Qlik sense. Here is something that is more useful. Inspired from the hierarchy tree of d3, driver tree has lot more features. Below is the list of some of those.

Features:

  1. Visualize hierarchies
  2. Multiple measures can be seen.
  3. Collapse and expand the different levels of hierarchy.

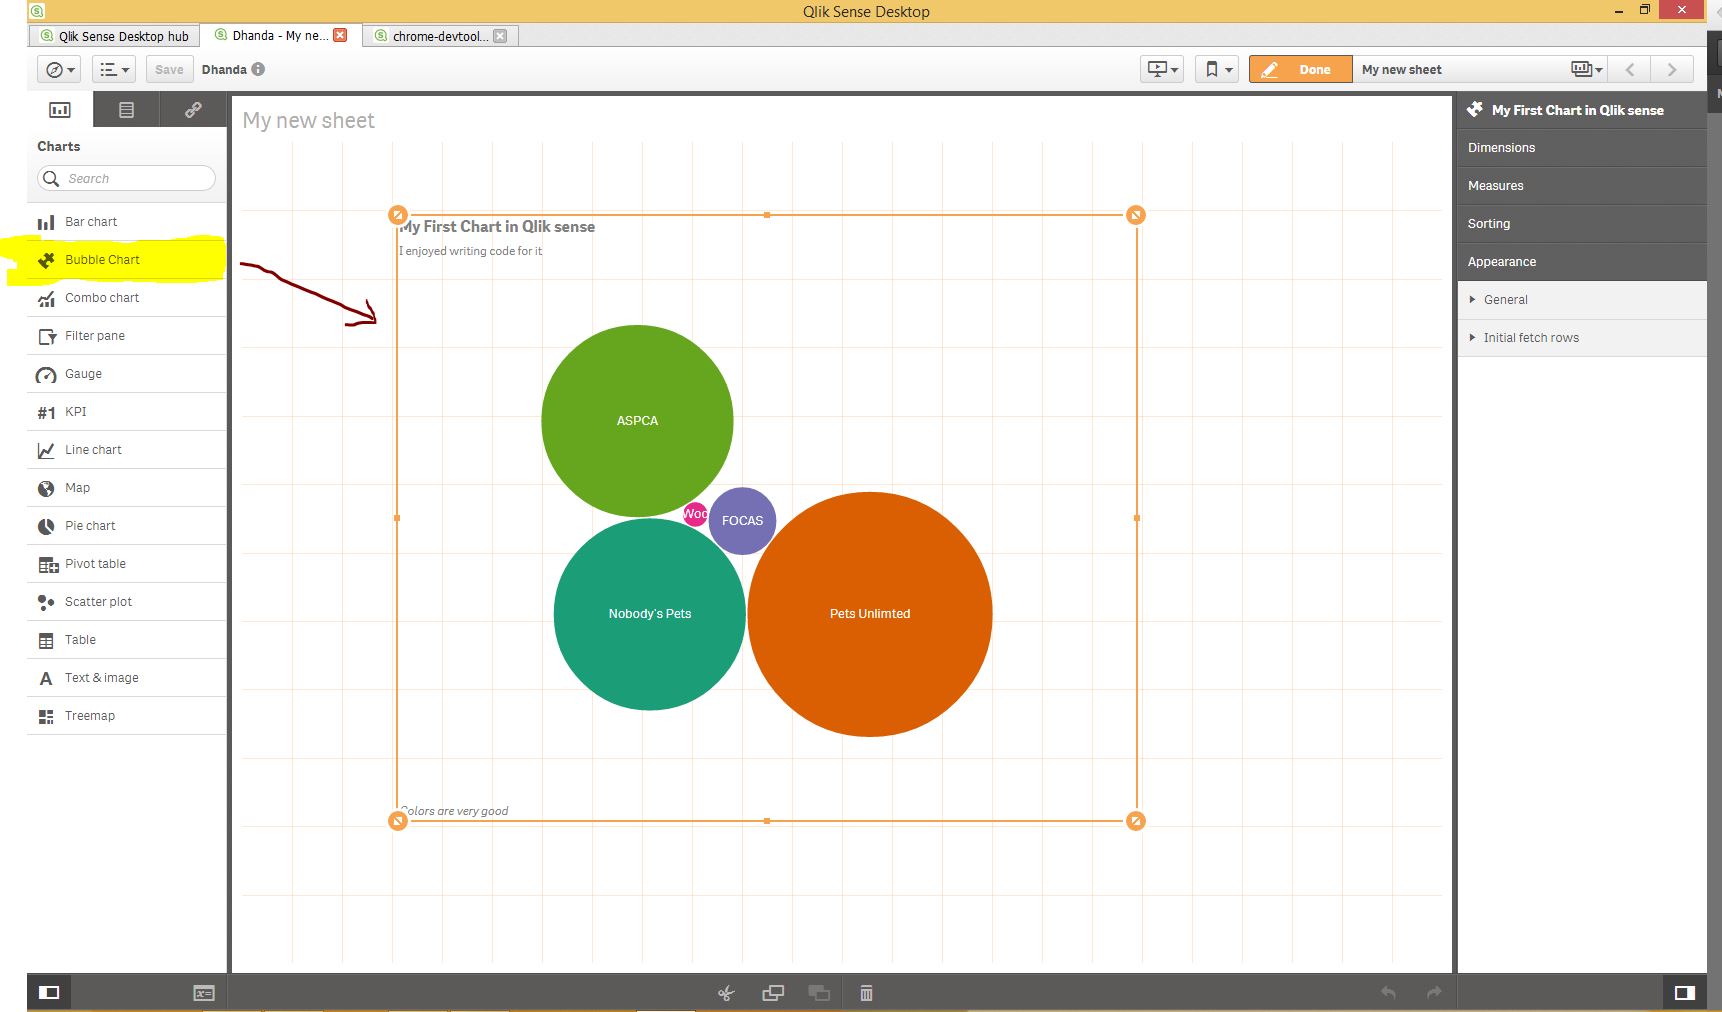
Below is screenshot of working example

Qlik-DriverTree


Download the custom visuals from here : https://github.com/dhandaweb/Qlik-sense-charts

Custom visualization for Qlik sense (Bubble chart)

Over the past 1 year I have been developing lot of charts with d3.js. and I thought of taking it to next level.

So just for fun I was exploring the Qlik sense developer environment and got to know that developing custom visualization in Qlik sense is not that hard.

I started with downloading the desktop version of Qlik sense and started following a simple tutorial.

In just 3 hours, I manage to develop the BUBBLE CHART in Qlik sense. Please see the image below.


Qliksense-custom-visualization

Download the extension files from here :https://github.com/dhandaweb/Qlik-sense-charts

Now creating a bubble chart was simple but main aim of this exercise was to understand:

  • How the development environment works.
  • How we can test and trouble shoot.
  • How it can be integrated in the current system.
  • How the Back end Api’s work.

Now that I understand all above I will be sharing some very existing visualization for Qlik sense in my next posts.