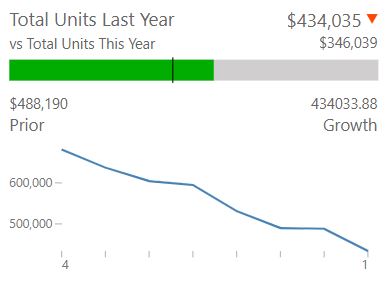
Sparkline show the actual and target measure with respect to period.
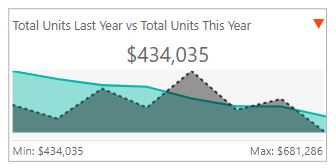
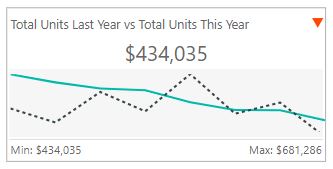
Sparkline show the actual and target measure with respect to period.
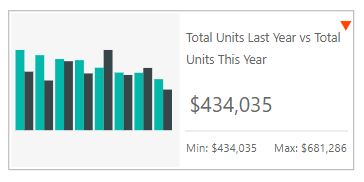
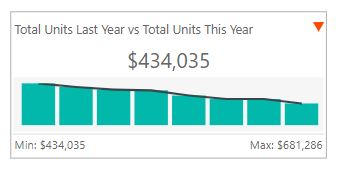
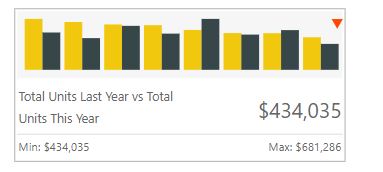
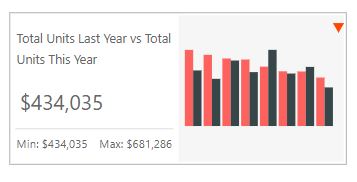
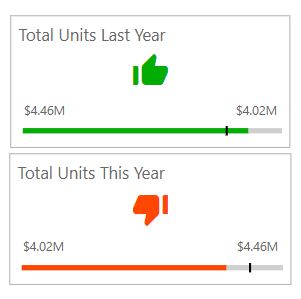
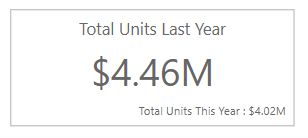
Card able to show two measure with actual and target. It works very well with filter and mostly used on top of the report. It consist of following templates:
Get more information | Buy now
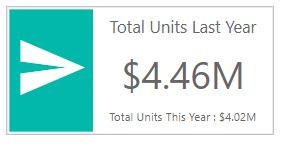
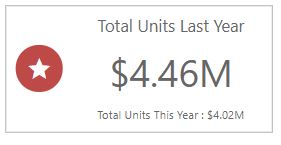
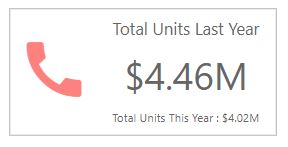
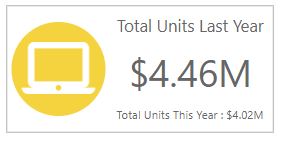
Status Card
Text card
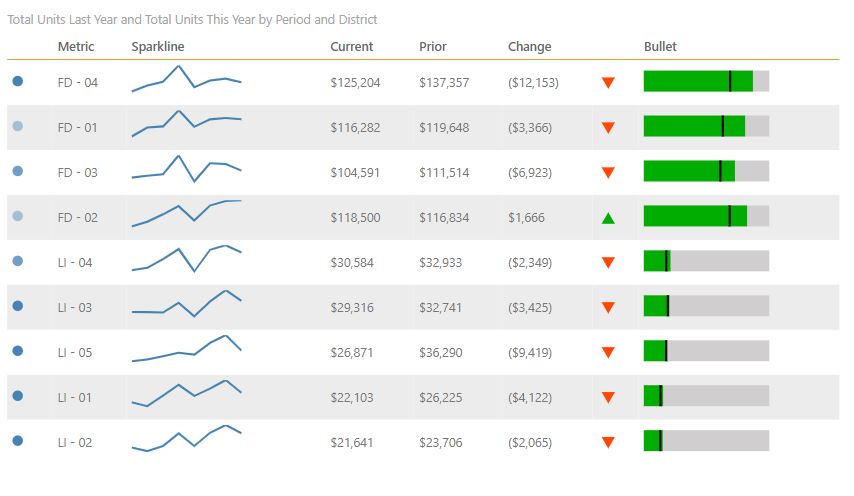
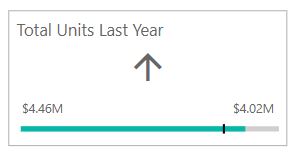
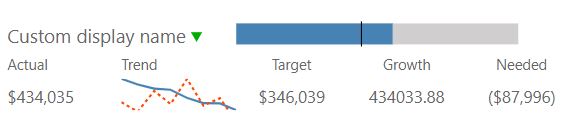
KPI card is the combination of bullet and sparkline which helps to understand actual vs target and trend with respect to period.
Get more information | Buy now
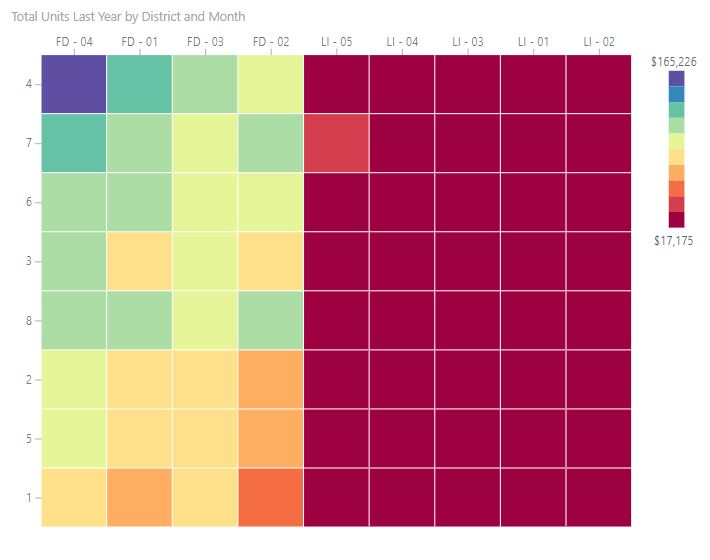
Linear template
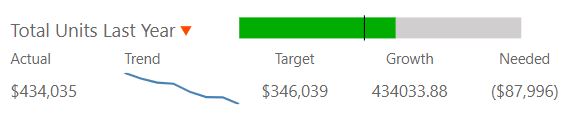
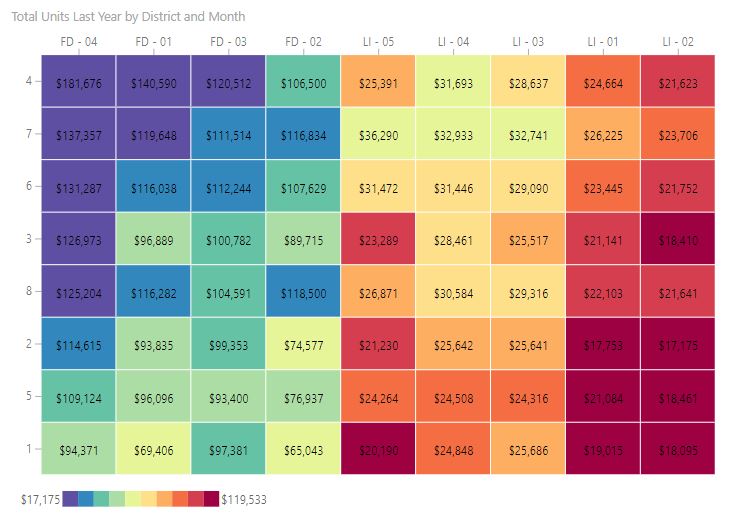
Group template
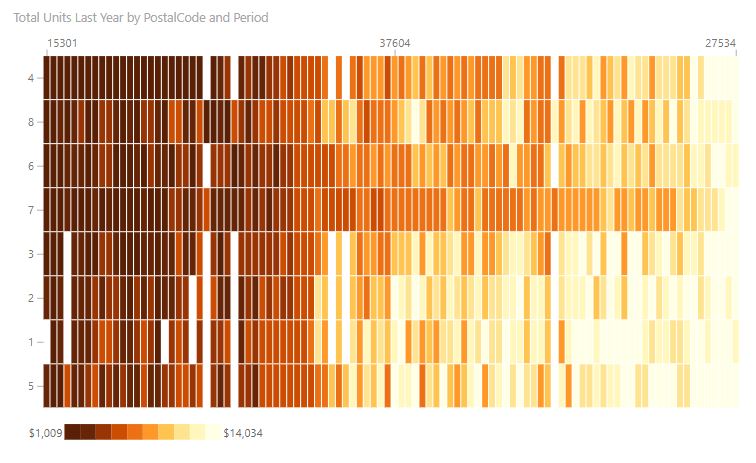
Heatmap are useful to understand the relationship between a single measure and two attributes. It displays data in 2 dimension in data matrix.
Get more information | Buy now
Barcode chart for powerBI
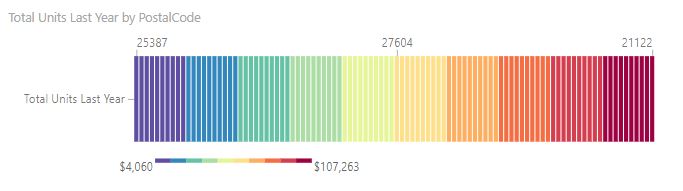
Multiple sparkline shows dimension trend and period change intensity. I also shows actual vs target bullet.
Get more information | Buy now