Typography effect on user experience

No wonder words are the heart of the any web application but choosing right words and right typography is very important.

Typography is the first impression

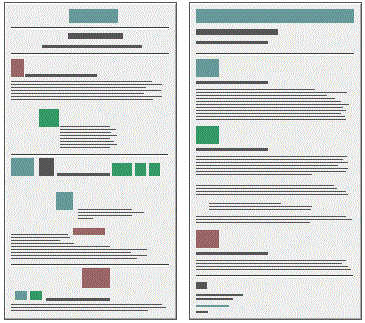
Typography is the body language and first impression of your website. It gives the feel and voice to the website. Below is the simple example :

Bad                            Good

page_layout

So make sure you style and design you webpage properly.Don’t forget the power of the white space and alignment.

User reads very less

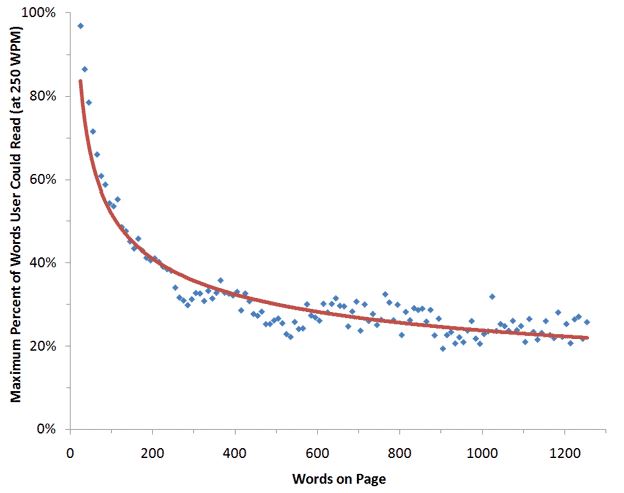
Before we move on to the styling and fonts, lets try to understand how much user reads. A normal user can read 250 words per minute which means users can read 18 words in 4.4 seconds.

A study in 2008 conducted by Herzlich willkommen and Jakob Nielson and they come to the conclusion that user reads only 20% of the text on web page. This analysis was done on 45,237 page views with words length varies from 30 – 1,250 words for 25 different users.

How-users-read-web-pages

Conclusion:  Users reads about 20% of the text on the web page.

Choose your words carefully

Now that we know less words makes more sense, so choose your words carefully.

Think of the way you want to present story to someone. The first thing that will come to your mind is that it should appealing and engaging. To do that you should arrange you words in such a way that it will excite someone from the first word.


Readability and comprehension

Readability is also the key factor that engage the user. It mainly depends on the four things:

  • Font size
  • Font type
  • Age of the reader
  • Line spacing


User Experience – Mobile first designs

What is mobile first designs?

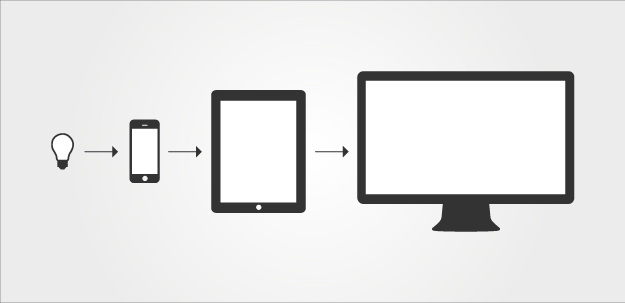
Mobile first is the strategy or approach of making web pages (application) works with best usability, perfect functionality and visually attractive on mobile (small screens) as a first step.

mobile-first-ux


What is difference between mobile and desktop when designing user experience?

  Desktop Mobile
Space More Space Less Space
Internet connection Trouble free, more stable Less stable, more trouble
Time User have time User is always in hurry
Screen Fixed Flipping
Call to action buttons Vary in size Big enough to be touched with thumb or finger


Tips for Mobile first design

  1. Forget the existing desktop environment.

If you are starting with a new project, forget everything about desktop. Only think of the small screen, less resources, less space and most important content.

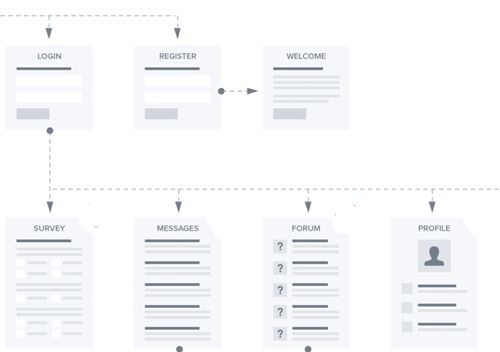
2. Draw user flow

Identify the key steps of the application and draw the user flow out of it.

mobile-ux-user-flow


3. Identify the key content

Mobile first is also understanding of the key content of the application. Limitation of the size and need of bigger font size forces you to choose the most important content.

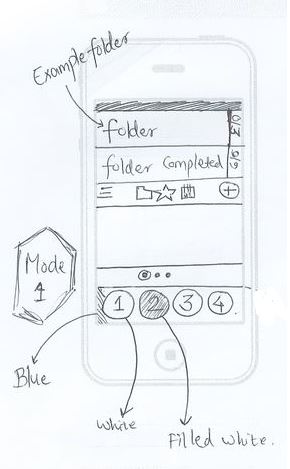
4. Draw your ideas on paper

Experiment your ideas by drawing it on paper. Drawing on paper is the best way to find the right solution soon.

Mobile-ux-hand-design-example

5. Use meaningful icons

Icons are most important thing in the mobile design. Choose your icons wisely and be consistent though out your application. Make sure you are using the standard icons like remove as bin icon, cancel as close icon.

6. Provide notification (feedback)

Always provide user with the feedback if something is going wrong. Lets say internet connection is lost. Let the user aware of it. Providing user constant feedback not only prevent their time but they will also trust you more.

Driver tree (hierachy tree) in Qlik sense

Now that I got to know how the custom visuals can be developed in Qlik sense. Here is something that is more useful. Inspired from the hierarchy tree of d3, driver tree has lot more features. Below is the list of some of those.

Features:

  1. Visualize hierarchies
  2. Multiple measures can be seen.
  3. Collapse and expand the different levels of hierarchy.

Below is screenshot of working example

Qlik-DriverTree


Download the custom visuals from here : https://github.com/dhandaweb/Qlik-sense-charts

Custom visualization for Qlik sense (Bubble chart)

Over the past 1 year I have been developing lot of charts with d3.js. and I thought of taking it to next level.

So just for fun I was exploring the Qlik sense developer environment and got to know that developing custom visualization in Qlik sense is not that hard.

I started with downloading the desktop version of Qlik sense and started following a simple tutorial.

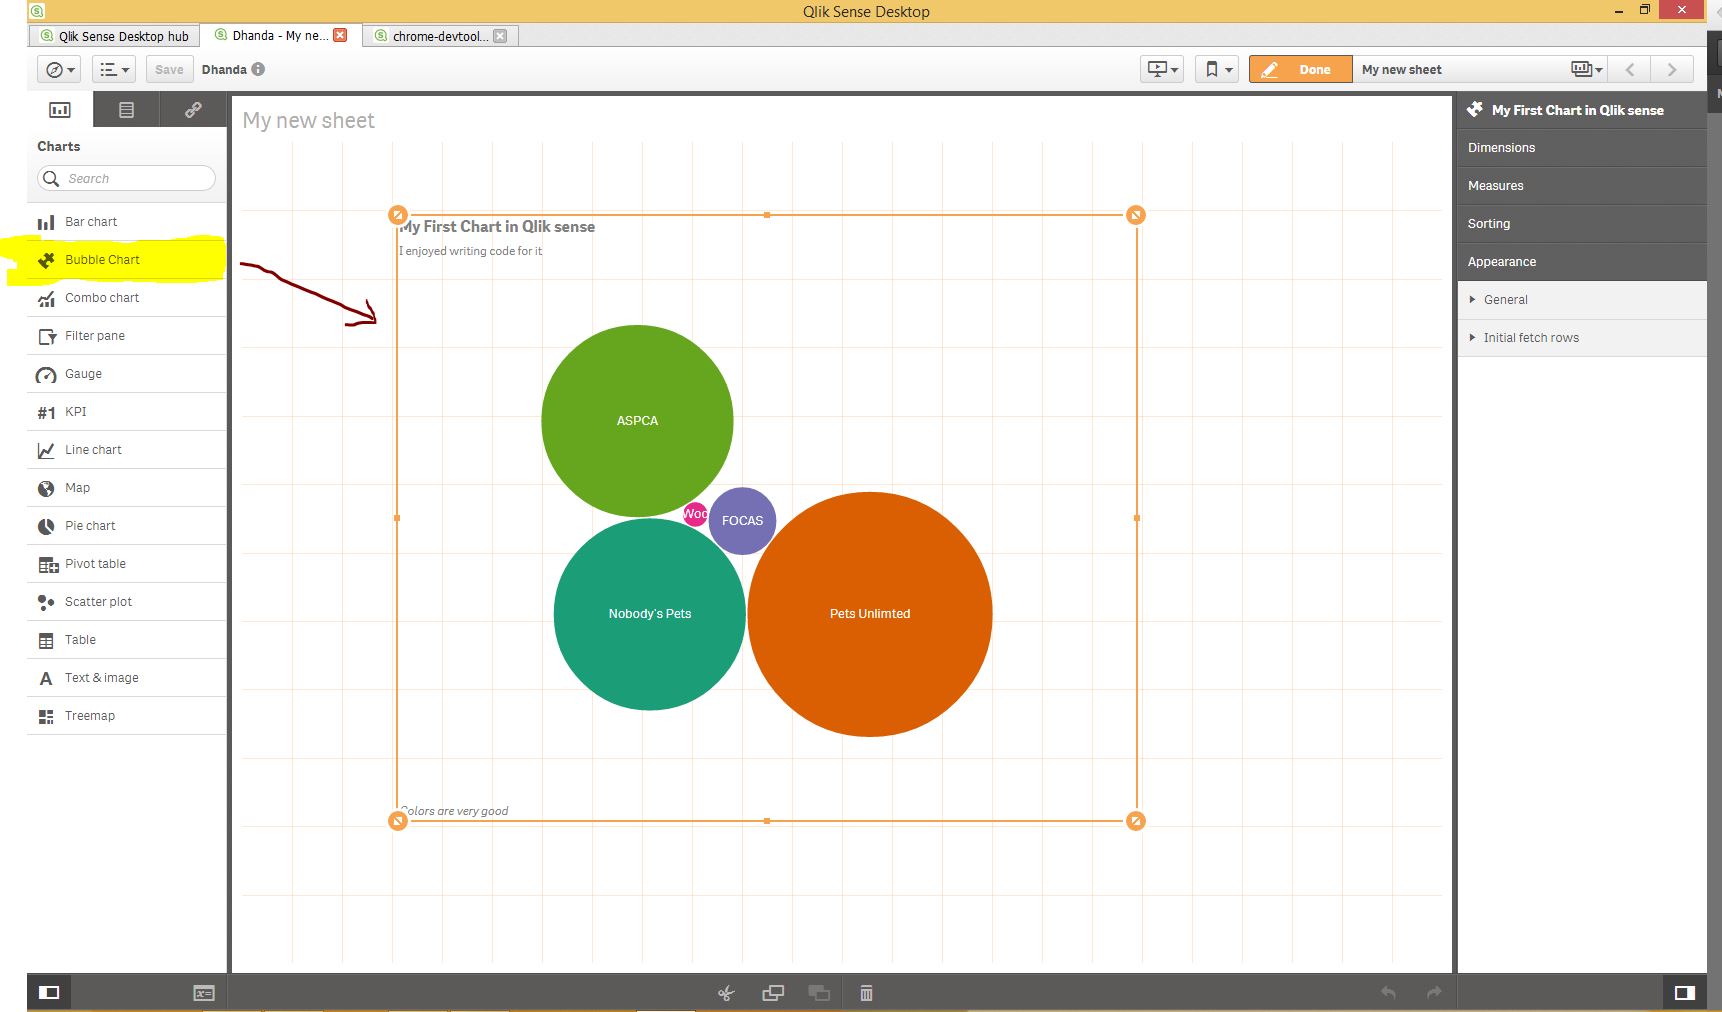
In just 3 hours, I manage to develop the BUBBLE CHART in Qlik sense. Please see the image below.


Qliksense-custom-visualization

Download the extension files from here :https://github.com/dhandaweb/Qlik-sense-charts

Now creating a bubble chart was simple but main aim of this exercise was to understand:

  • How the development environment works.
  • How we can test and trouble shoot.
  • How it can be integrated in the current system.
  • How the Back end Api’s work.

Now that I understand all above I will be sharing some very existing visualization for Qlik sense in my next posts.