Pie charts ! Please die

I don’t like pie charts and if it is 3D pie chart then I will kill you.

People are using pie charts from last two centuries and if you will tell them pie charts are bad then you can see the sense of confusion on their face. Some will laugh at you.

But here are some of the reasons to support my argument.

1.Color means nothing?

Pei-chart-Vs-BarChart

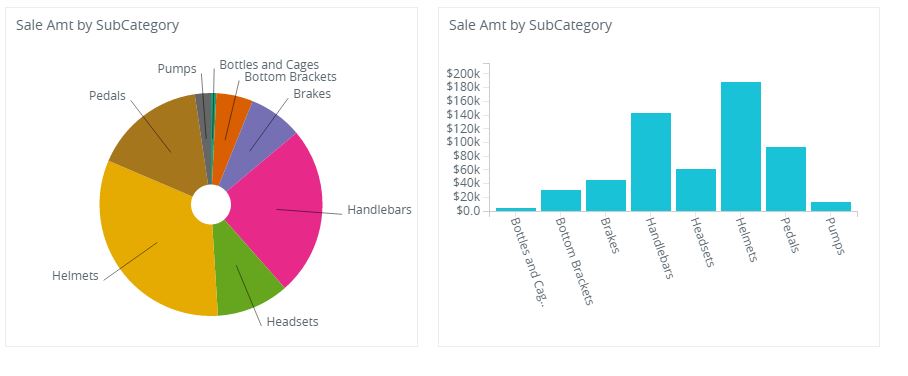
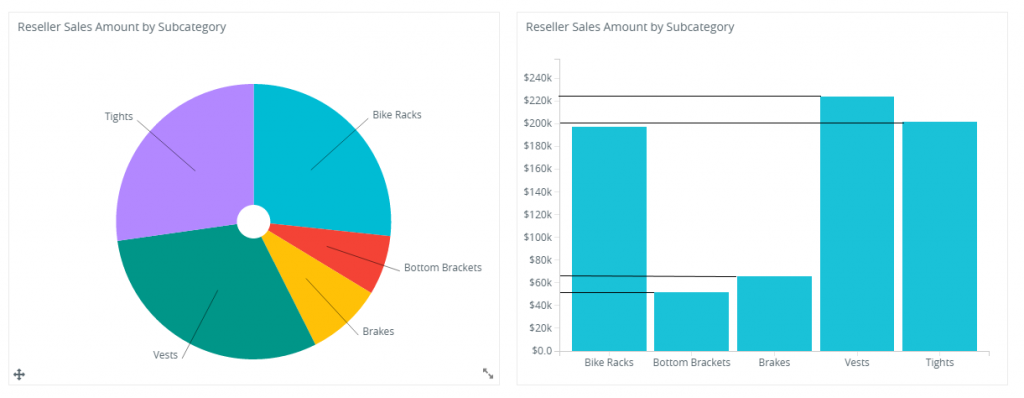
In the example above can anyone tell me what is the meaning of the color? Is that just for differentiation of the pie from each other ?

2. Pies tell nothing if the numbers fall near to each other?

worstPieChart

Let’s pie chart in the example above is showing the sales amount. Can anyone answer the following question :

  • Which category has the highest sale?
  • Are “Brakes” and “Bottom Brackets” are equal?
  • What is the difference between “Vests” and “Tights“?

Unless you have bar chart in the right side. I think its very hard to answer all above question.

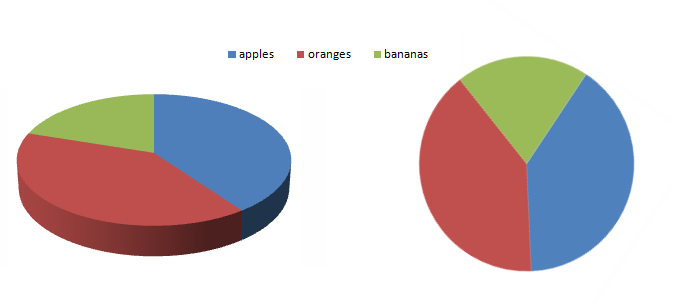
3. 3D Pie Chart : best way to mislead.

3D pie fool

If a normal eye look at the 3D pie chart on the left. It would get an impression that oranges (in maroon color) had the most of the share where as if we look the same chart in 2D we will get to know that both oranges and Apples have same share.


Why branding and design is so important for the success of the web application

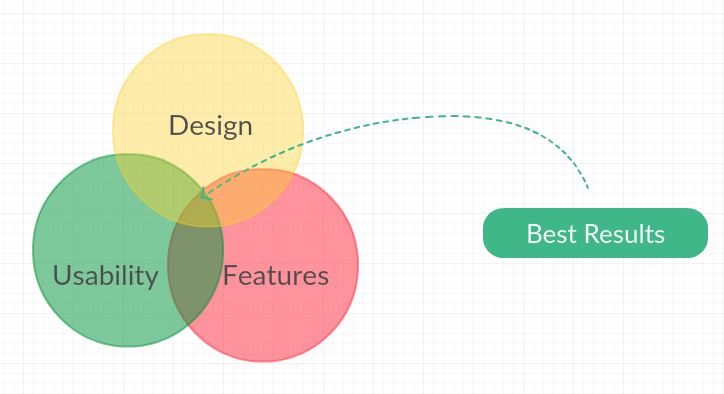
Companies are always trying to come up with a formula to produce successful web application. A lot has been said  about the reasons of success of the web application but there is no barometer that can give you exact formula. Some of the common reasons are listed below:

  • Features and Purpose
  • User Experience
  • Design and Branding

Most of the time it is the right combination of the above three that will give you the best result.

design-features

To understand which is more important among them. Let us do an exercise by choosing 5 different web application from internet and 10 random people.

Give 10 minutes to all of them to play with 5 websites (2 minutes for each website).

Now ask them following question:

  • What is the first thing you remember about any random website ?
    90% of the people will remember the color or pictures or logo of the website.
  • What is second thing you remember about any random website ?
    Majority of people would be saying transition or big buttons.
  • What was website all about?
    Out of 10 people only 2 will be able to describe not more than 2 websites.
  • Which one was the best website ?
    Most of them will tell you the website by their base color (say black background one).


Form all the above answers one can determine how important branding and design of the website is ? Your website need not to be an award winning design website but you cannot simply ignore it.


Parallel coordinates chart for power bi

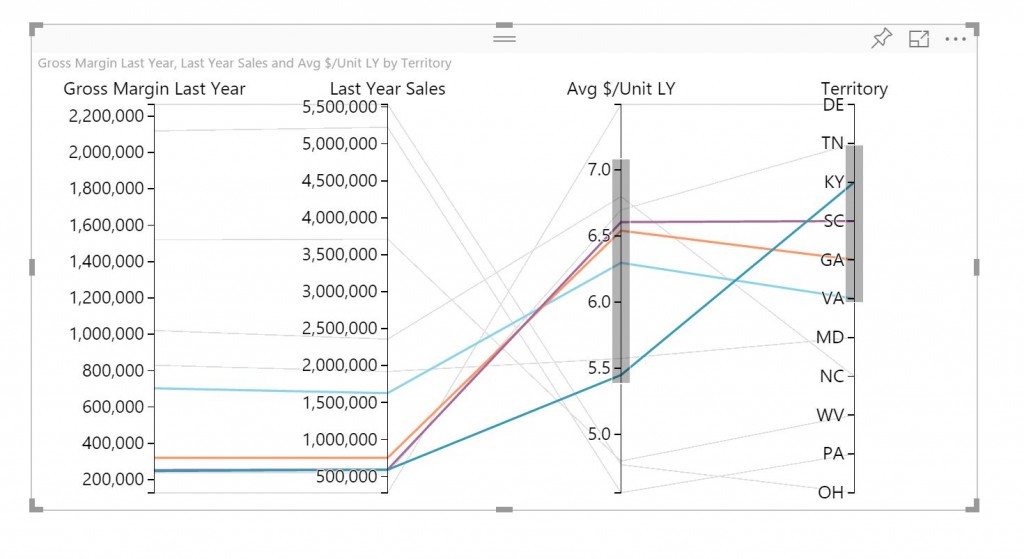
Good news!  for the people asking me for parallel coordinates chart on my blog.

Here is the upgraded version of parallel coordinates chart which accepts

  • 1 Dimension attribute
  • Multiple measure.

parallel-t

Download Microsoft PowerBI File.

Check you tube video for demo of the parallel coordinates chart.

If you don’t know how to use custom visuals for power bi. Check this link https://app.powerbi.com/visuals/info

Story Telling with impress.js and D3.js

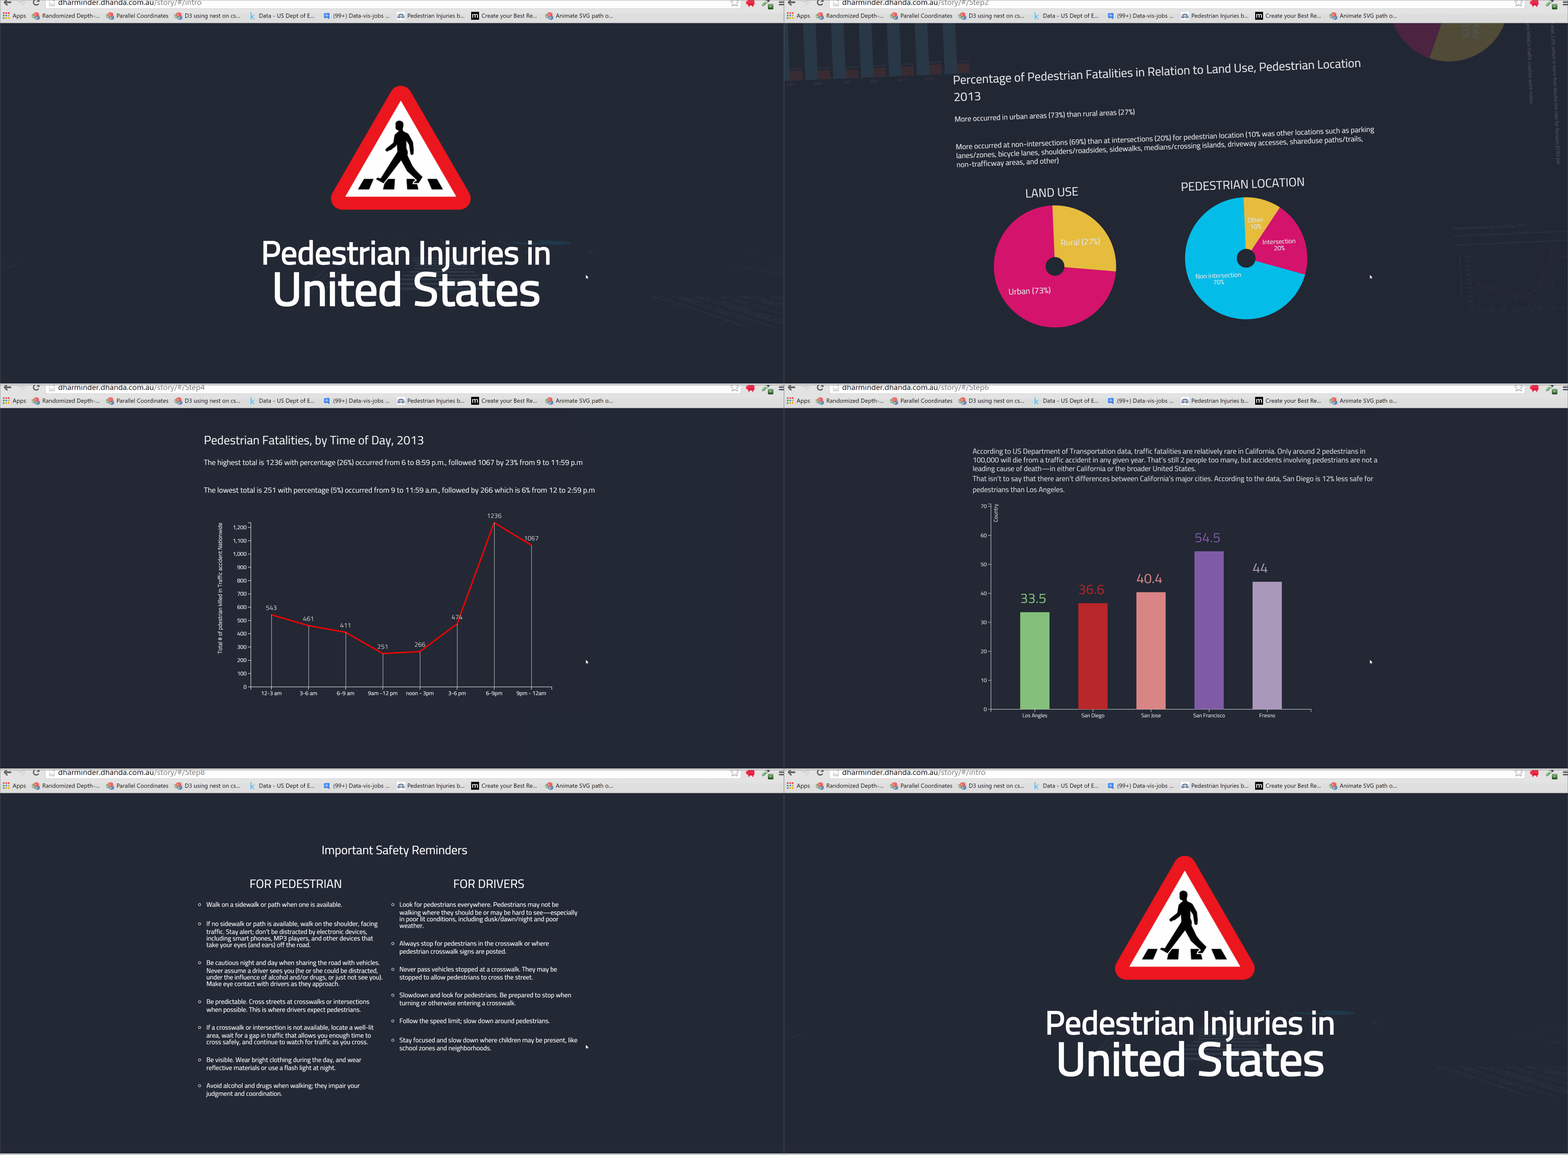
ped

From last 2 weeks I am trying to find out the best ways for story telling with data. I am already using d3.js and can create pretty animation with that but that is not good enough.

I was looking for the some thing that is more impressive and interactive. Then i found free java script library impress.js. We can do some cool stuff with it.

National Center for Statistics and Analysis of United states brought up the facts from their data about the fatalities of pedestrians in United states. Based on the data published on this report on their website, I have created a story that is far more interactive and easy to understand their report.

Link to the story : dharminder.dhanda.com.au/story/