Area charts are useful for displaying data over time.
Multiple measures can be included in the Values field. These will be displayed in a drop down box on the top right hand corner of the chart.
Properties of Area Chart
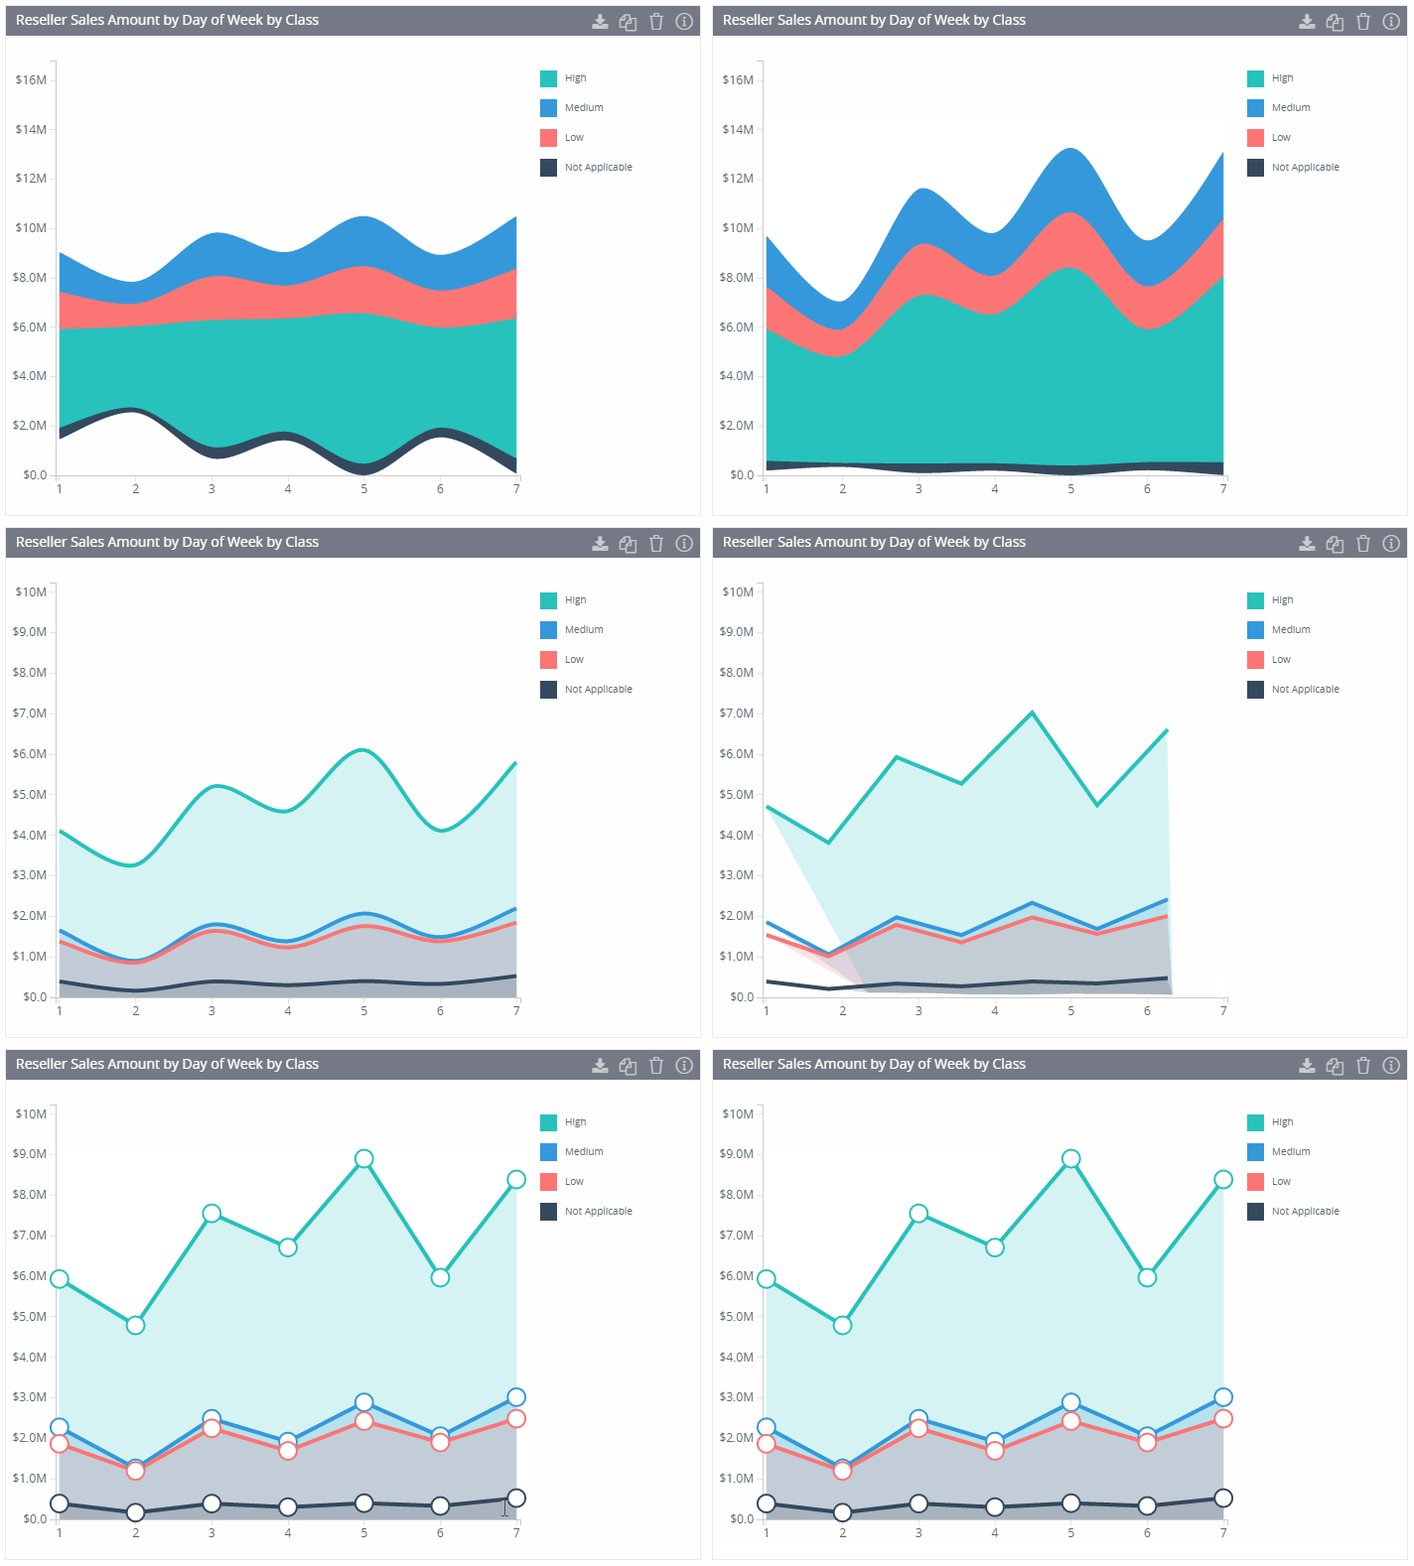
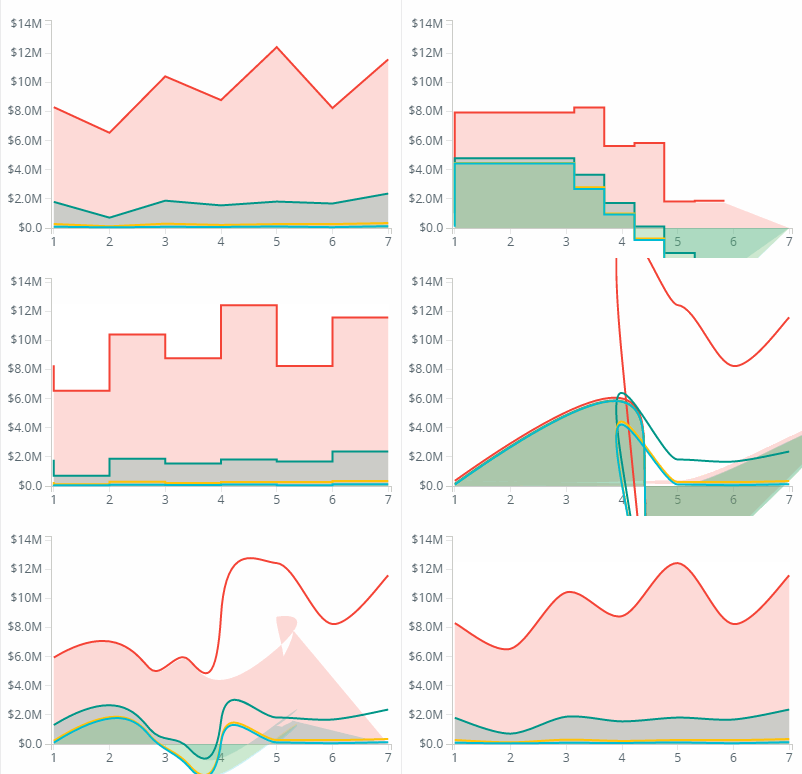
- Curve Type (linear, monotone, step-up, step-down)
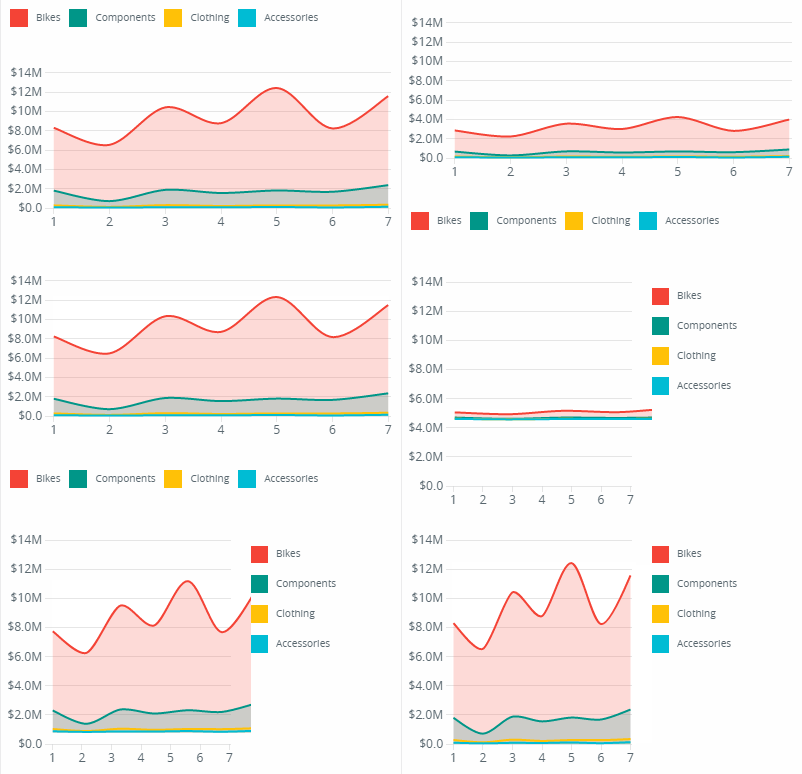
2. Legend Position (Top, bottom, right)
3.Axis Labels (show/hide)
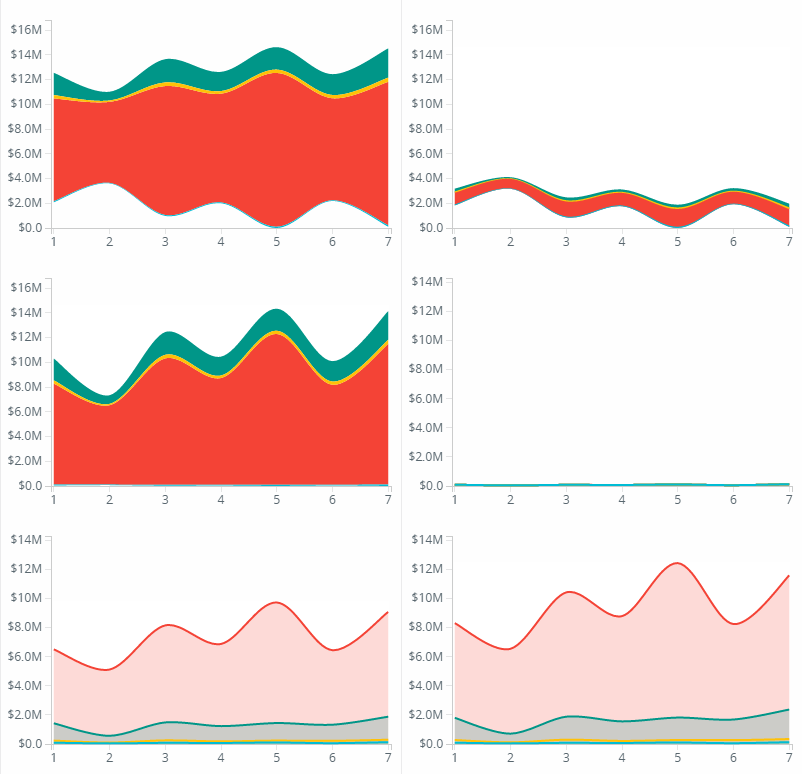
4. Area Type (horizon, stack, stream)
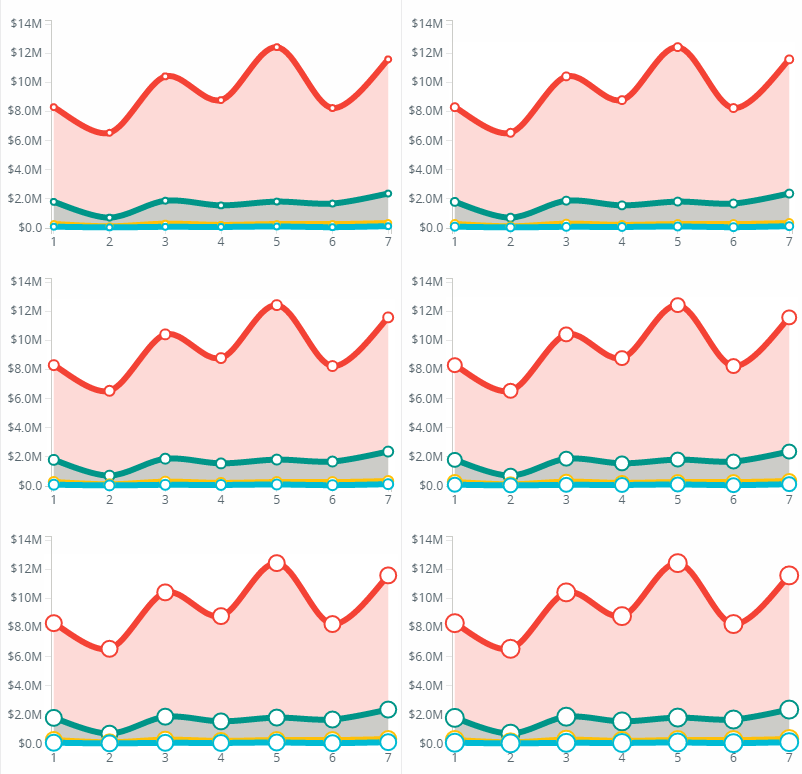
5. Line Stroke, Tooltip circles
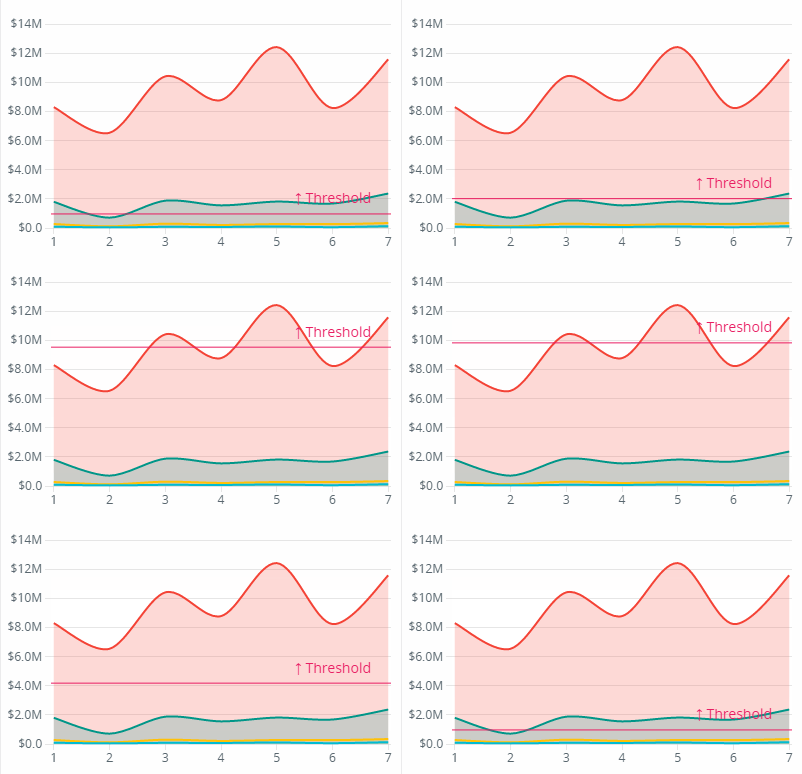
5. Threshold line
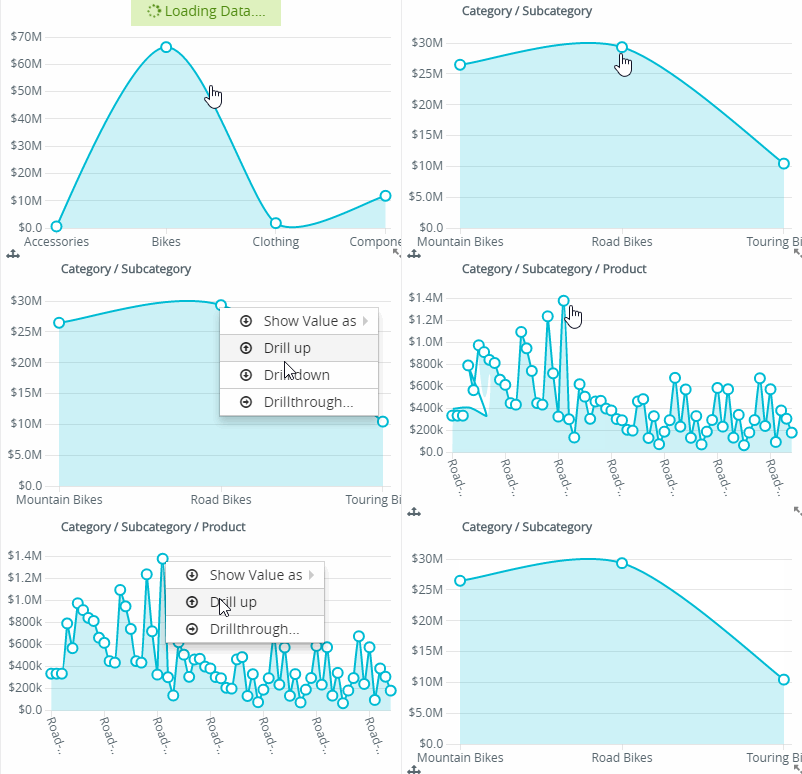
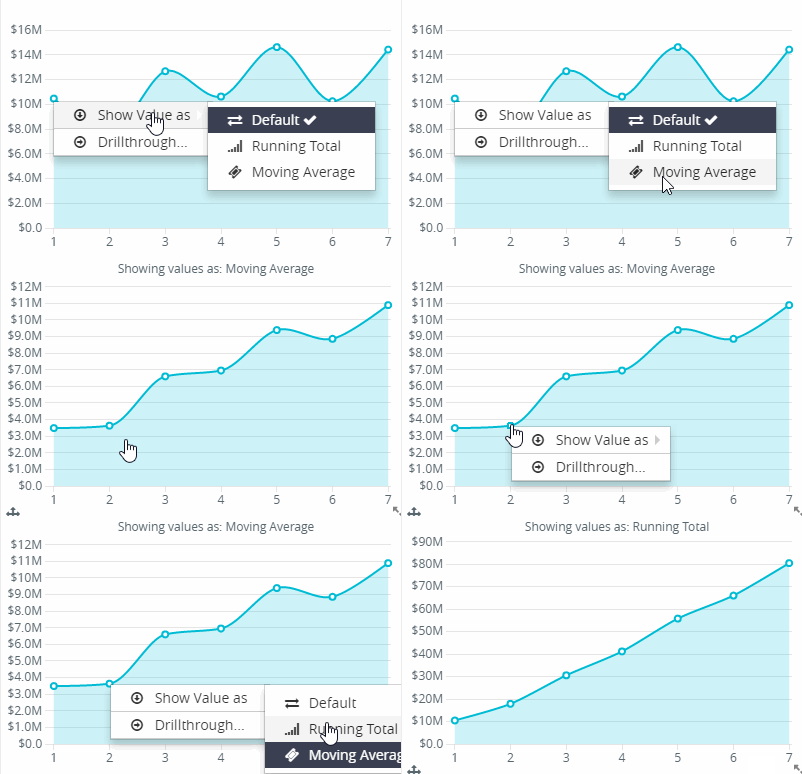
6. Drill up and drill down data
7. Analytic
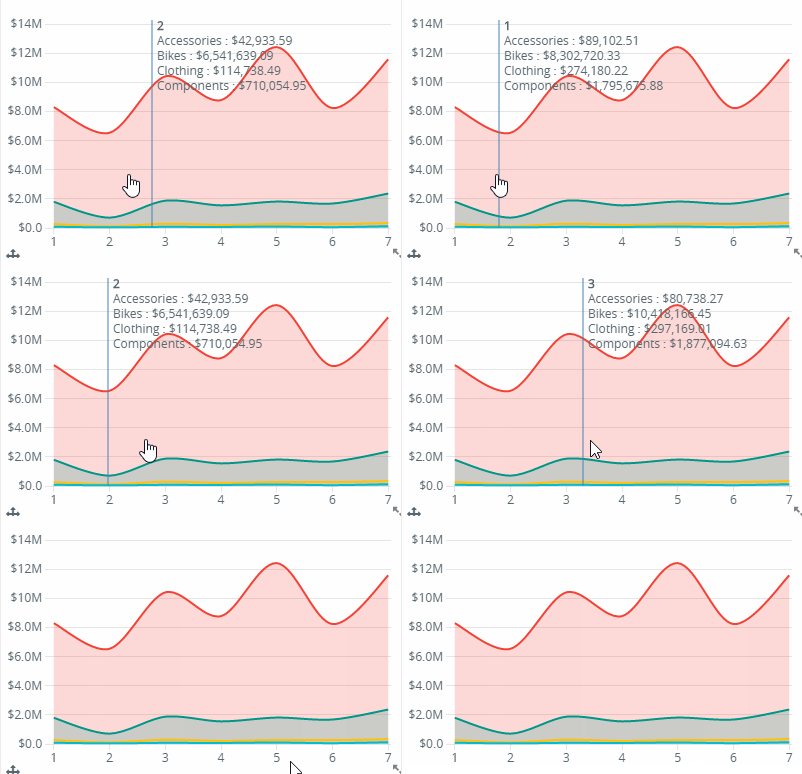
8. Bisector tool tip
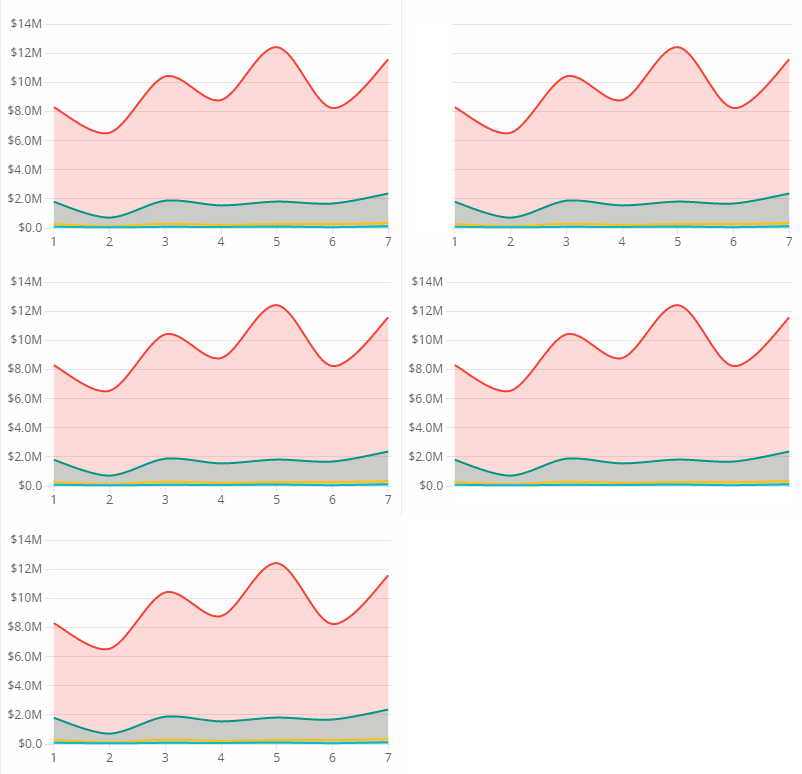
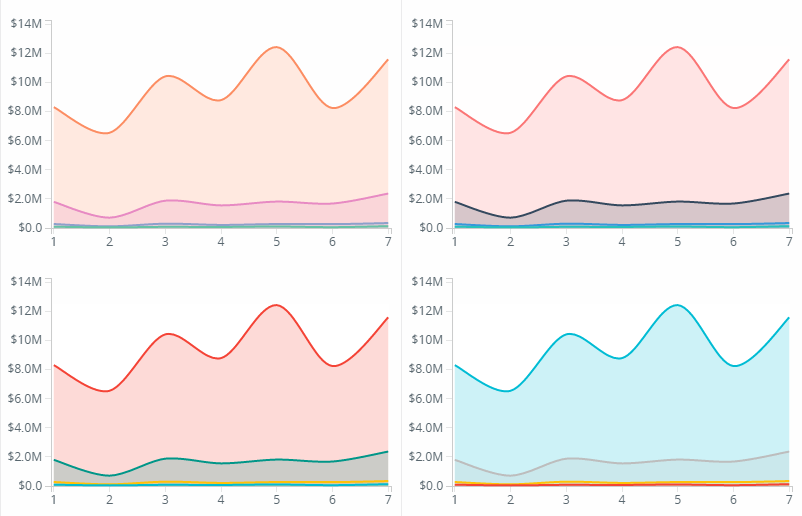
10. Changing color
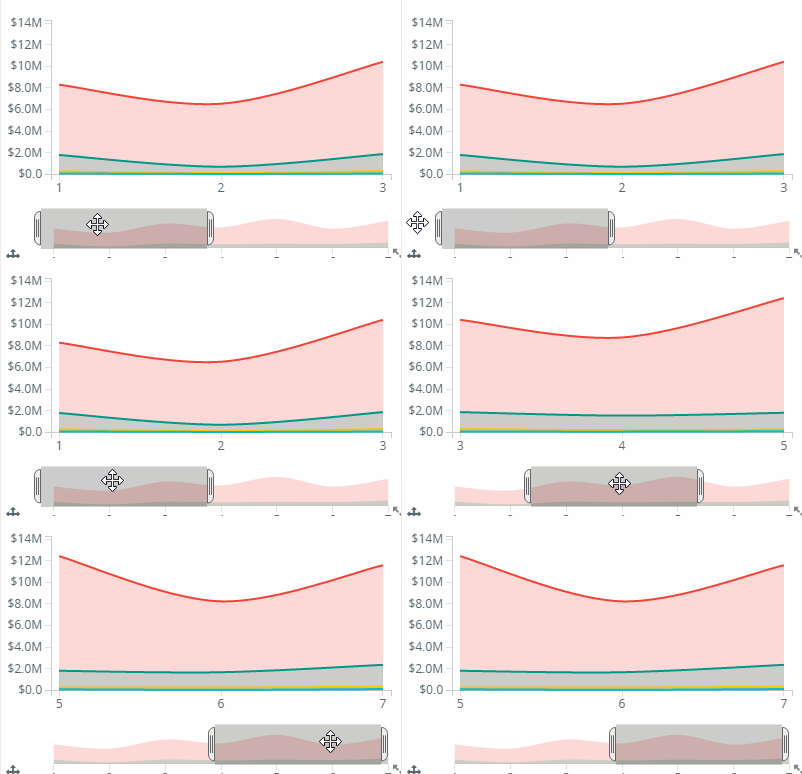
11. Context bar
